Results measured. Problems solved. Numbers that moved.
Every project starts with a KPI and ends when it moves. Here's the evidence.

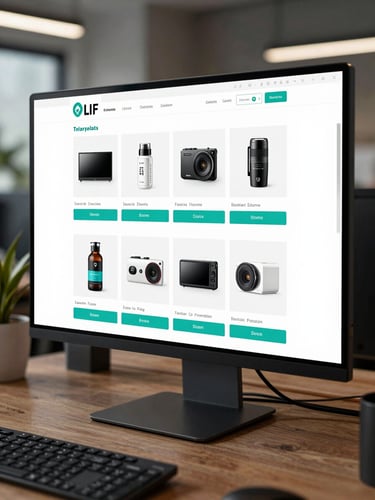
Cart abandonment cut by 38%
A mid-market apparel brand had a checkout flow that stalled at 61% abandonment. We rebuilt the UX, rewired the product API, and ran conversion-rate optimization across three traffic channels.
38% reduction in cart abandonment. Revenue per session up $4.20. Paid CAC dropped 22% within 90 days of launch.
Disciplines: UX Design, Frontend Development, CRO, Paid Media.


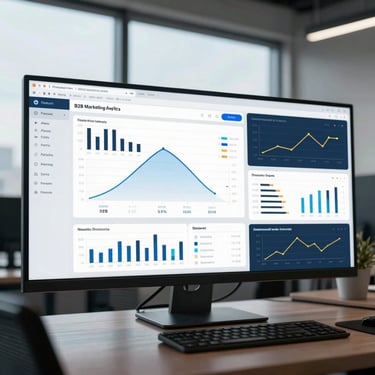
Three disciplines, one accountability
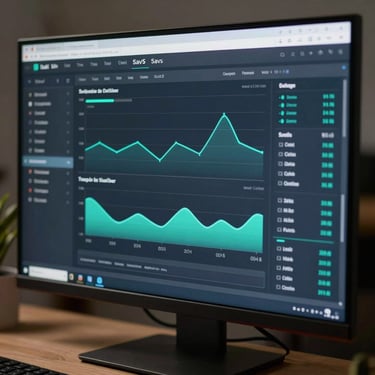
Activation rate up 54%
Organic revenue doubled
Zero to launch in 11 weeks
An ecommerce brand with no SEO infrastructure. We built the content engine and technical foundation. Organic channel revenue doubled in under six months.
A seed-stage startup needed a live product to close their Series A. Design, development, and go-to-market strategy delivered in 11 weeks. Round closed at target.
A B2B SaaS tool had a 12-step onboarding that lost 70% of signups. Redesigned to 4 steps. Activation to paid conversion rose 54% in 60 days.
Have a number you need to move?
Bring the brief. We scope against outcomes, not hours. If the metric doesn't move, neither does the engagement.